Provision and integrate iSCSI storage with VMware Cloud on AWS using Amazon FSx for NetApp ONTAP

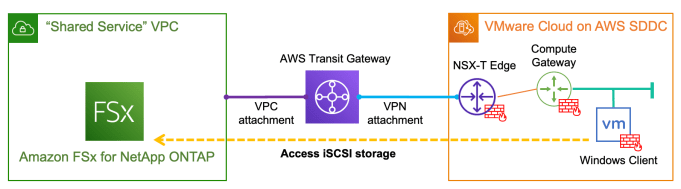
With the recently announced Amazon FSx for NetApp ONTAP, it is very exciting that for the first time we have a fully managed ONTAP file system in the cloud! What’s more interesting about this service is that we can now deliver high-performance block storage to the workloads running on VMware Cloud on AWS (VMC) through a first-party Amazon managed service!

In this post I will walk you through a simple example for provisioning and integrating iSCSI-based block storage to a Windows workload running on VMC environment using Amazon FSx for NetAPP ONTAP. For this demo I’ve provisioned the FSx service in a shared service VPC, which is connected to the VMC SDDC cluster through an AWS Transit Gateway (TGW) via VPN attachment (as per below diagram).

Depending on your environment or requirements, you can also leverage a VMware Transit Connect (or VTGW) to provide high speed VPC connections between the shared service VPC and VMC, or simply provision the FSx service in the connected VPC so no TGW/VTGW is required.

AWS Configuration

To begin, I simply go to AWS console and select FSx in the service category and provision an Amazon FSx for NetApp ONTAP service in my preferred region. As a quick summary I have used the below settings:

  • SSD storage capacity 1024GB (min 1024GB, max 192TB)
  • sustained throughput capacity 512MB/s
  • Multi-AZ (ontap cluster) deployment
  • 1x storage virtual machine (svm01) to provide iSCSI service
  • 1x default volume (/vol01) of 200GB to host the iSCSI LUNs
  • storage efficiency (deduplication/compression etc): enabled
  • capacity pool tiering policy: enabled

After around 20min wait, the FSx ONTAP file system will be provisioned and ready for service. If you are using the above settings you should see a summary page similar like below. You can also retrieve the management endpoint IP address under the “Network & Security” tab.

Note the management addresses (for both the cluster and SVMs) are automatically allocated from within a 198.19.0.0/16 range, and the same address block is going to provide the floating IP for NFS/SMB service (so customers don’t have to change file share mounting point address during an ONTAP cluster failover). Since this subnet is not natively deployed in a VPC, AWS will automatically inject the endpoint addresses (for management and NFS/SMB) into the specific VPC route tables based on your configurations.

However, you’ll need to specifically inject a static route for this (see below) on TGW/VTGW, especially if you are planning to provide NFS/SMB services to the VMC SDDCs over peering connections — see here for more details.

Conversely, this static route is not required if you are only using iSCSI services as the iSCSI endpoints are provisioned directly onto the native subnets hosting the FSx service and are not using the floating IP range — more on this later.

Next, we’ll verify the SVM (svm01) and Volume (vol01) status and make sure they are all online and healthy before we can provision iSCSI LUNs. Note: you’ll always see a separate root volume (automatically) created for each SVM.

Now click the “svm01” to dive into the details, and you’ll find the iSCSI endpoint IP addresses (again they are in the native VPC subnets not the mgmt floating IP range)

ONTAP CLI CONFIGURATION

We are now ready to move onto the iSCSI LUN provisioning. This can be done by using either ONTAP API or ONTAP CLI, which is what I’m using here. First, we’ll SSH into the cluster management IP and verify the SVM and volume status.

Since this is a fully managed service, iSCSI service has been already activated on the SVM and the cluster is listening for iSCSI sessions on the 2x subnets across both AZs. You’ll also find the iSCSI target name here.

Now we’ll create a 20GB LUN for the Windows client running on VMC.

Next, create an igroup to include the Windows client iSCSI initiator. Notice the ALUA feature is enabled by default — this is pretty cool as we can test iSCSI MPIO as well 🙂

Finally, map the igroup to the LUN we have just created, make sure the LUN is now in “mapped” status and we are all done here!

Windows Client Setup

On the Windows client (running on the VMC), launch the iSCSI initiator configuration and put the iSCSI IP address of one of the FSx subnets in “Quick Connect”, Windows will automatically discover the available targets on the FSx side and log into the fabric.

Optionally, you could add a secondary storage I/O path if MPIO is installed/enabled on the Windows client. Like in my example here, I have add a second iSCSI session by using another iSCSI endpoint address in a different FSx subnet/AZ.

Now click “Auto Configure” under “Volumes and Devices” to discover and configure the iSCSI LUN device.

Next, go to “Computer Management” then “Disk Management” —> you should see a new 20GB disk has been automatically discovered (or manually refresh the hardware list if you can’t see the new disk yet). Initialise and format the disk.

The new 20GB disk is now ready to use. In the disk properties, you can verify the 2x iSCSI I/O paths as per below, and you can also change the MPIO policy based on your own requirements.

Integrating a 3rd-party firewall appliance with VMware Cloud on AWS by leveraging a Security/Transit VPC

With the latest “Transit VPC” feature in the VMware Cloud on AWS (VMC) 1.12 release, you can now inject static routes in the VMware managed Transit Gateway (or VTGW) to forward SDDC egress traffic to a 3rd-party firewall appliance for security inspection. The firewall appliance is deployed in a Security/Transit VPC to provide transit routing and policy enforcement between SDDCs and workload VPCs, on-premises data center and the Internet.

Important Notes:

  • For this lab, I’m using a Palo Alto VM-Series Next-Generation Firewall Bundle 2 AMI – refer to here and here for a detailed deployment instructions
  • “Source/Destination Check” must be disabled on all ENIs attached to the firewall
  • For Internet access, SNAT must be configured on firewall appliance to maintain route symmetry
  • Similarly, inbound access from Internet to a server within VMC requires DNAT on firewall appliance

Lab Topology:

SDDC Group – Adding static (default) route

After deployed the SDDC and SDDC Group, link your AWS account at here

after a while, the VTGW will show up in the Resource Access Manager (RAM) within your account, accept the shared VTGW and then create a VPC attachment to connect your Security/Transit VPC to the VTGW.

Once done, add a static default route at SDDC Group to point to the VTGW-SecVPC attachment.

the default route should appear soon under your SDDC (Network & Security —> Transit Connect), also notice we are advertising the local SDDC segments including the management subnets

AWS SETUP

Also we need to update the route table for each of the 3x firewall subnets

Route Table for the AWS native side subnet-01 (Trust Zone):

Route Table for the SDDC side subnet-02 (Untrust Zone):

Route Table for the public side subnet-03 (Internet Zone):

Route Table for the customer managed TGW:

Palo FW Configuration

Palo Alto firewall interface configuration

Virtual Router config:

Security Zones

NAT Config

  • Outbound SNAT to Internet
  • Inbound DNAT to Server01 in SDDC01

Testing FW rules

Testing Results
  • “untrust” —> “trust” deny
  • “trust” —> “untrust” allow
  • “untrust” -> “Internet” allow
  • “trust” -> “Internet” allow

Build a Serverless CI/CD pipeline on AWS with Fargate, CodePipeline and Terraform

This blog provides an example for deploying a CI/CD pipeline on AWS utilising the serverless container platform Fargate and the fully managed CodePipeline service. We’ll also use Terraform to automate the process for building the entire AWS environment, as shown in the below diagram.

Specifically, we’ll be creating the following AWS resources:

  • 1x demo VPC including public/private subnets, NAT gateway and security groups etc
  • 1x ALB for providing LB services to a target group of 2x Fargate container tasks
  • 1x ECS cluster with a Fargate service definition (running our demo app)
  • 1x CodePipeline definition, which builds the demo app from GitHub Repo (with a webhook trigger) and deploys it to the same Fargate service
  • 1x ECR repository for hosting pipeline build images
  • 2x S3 Buckets as build & artifact cache

References – for this demo, I’m using these Terraform modules found on GitHub:

PREREQUISITES

  • Access to an AWS testing environment
  • Install Git & Terraform on your client
  • Install AWS toolkits including AWS CLI, AWS-IAM-Authenticator
  • Check the NTP clock & sync status on your client —> important!
  • Clone or donwload the Terraform code at here.
  • Clone or fork the demo app (including CodePipeline buildspec) at here.

Step-1: Review the Terraform Script

Let’s take a close look of the Terraform code. I’ll skip the VPC and ALB sections and focus on the ECS/Fargate service and CodePipeline definition.

This section creates an ECS cluster with the Fargate service definition, note I have put a bitnami node image for testing purpose and it will get replaced automatically by our demo app via the CodPipeline execution.

############################# Create ECS Cluster and Fargate Service ##################################


resource "aws_ecs_cluster" "ecs_cluster" {
  name = "default"
}


module "ecs_fargate" {
  source           = "git::https://github.com/tmknom/terraform-aws-ecs-fargate.git?ref=tags/2.0.0"
  name             = var.ecs_service_name
  container_name   = var.container_name
  container_port   = var.container_port
  cluster          = aws_ecs_cluster.ecs_cluster.arn
  subnets          = module.vpc.public_subnets
  target_group_arn = join("", module.alb.target_group_arns)
  vpc_id           = module.vpc.vpc_id

  container_definitions = jsonencode([
    {
      name      = var.container_name
      image     = "bitnami/node:latest"
      essential = true
      portMappings = [
        {
          containerPort = var.container_port
          protocol      = "tcp"
        }
      ]
    }
  ])

  desired_count                      = 2
  deployment_maximum_percent         = 200
  deployment_minimum_healthy_percent = 100
  deployment_controller_type         = "ECS"
  assign_public_ip                   = true
  health_check_grace_period_seconds  = 10
  platform_version                   = "LATEST"
  source_cidr_blocks                 = ["0.0.0.0/0"]
  cpu                                = 256
  memory                             = 512
  requires_compatibilities           = ["FARGATE"]
  iam_path                           = "/service_role/"
  description                        = "Fargate demo example"
  enabled                            = true

  tags = {
    Environment = "Dev"
  }
}

This section creates an ECR repository (for hosting the build image) and defines the pipeline, which builds the demo app from GitHub repo, pushes the new image to ECR and deploys it to the same ECS cluster and Fargate service as created from the above.

################################### Create ECR Repo and Code Pipeline ###################################


resource "aws_ecr_repository" "fargate-repo" {
  name = var.ecr_repo

  image_scanning_configuration {
    scan_on_push = true
  }
}

module "ecs_codepipeline" {
  source                = "git::https://github.com/cloudposse/terraform-aws-ecs-codepipeline.git?ref=master"
  name                  = var.app_name
  namespace             = var.namespace
  region                = var.region
  image_repo_name       = var.ecr_repo
  stage                 = var.stage
  github_oauth_token    = var.github_oath_token
  github_webhooks_token = var.github_webhooks_token
  webhook_enabled       = "true"
  repo_owner            = var.github_repo_owner
  repo_name             = var.github_repo_name
  branch                = "master"
  service_name          = module.ecs_fargate.ecs_service_name
  ecs_cluster_name      = aws_ecs_cluster.ecs_cluster.arn
  privileged_mode       = "true"
}

Note the pipeline is synced to GitHub with a webhook trigger enabled, and you’ll need to supply a GitHub personal token for this. So go create one if you haven’t already done so.

This image has an empty alt attribute; its file name is image.png

Step-2: Create the Serverless Pipeline with Terraform

Configure AWS environment variables

[root@cloud-ops01 tf-aws-eks]# aws configure
AWS Access Key ID [*****]: 
AWS Secret Access Key [***]: 
Default region name [us-east-1]: 
Default output format [json]:

update terraform.tfvars based on your own environment

region = "us-east-1"
ecs_service_name = "ecs-svc-example"
container_port = 3000
container_name = "demo-app"
namespace = "xxx"
stage = "dev"
app_name = "demo-app-xxxx"
ecr_repo = "fargate-demo-repo"
github_oath_token = "xxxx"
github_webhooks_token = "xxxx"
github_repo_owner = "xxxx"
github_repo_name = "fargate-demo-app"

Now run the Terraform script

terraform init
terraform apply

The process will take about 5 mins and you should see an output like this. Note the public URL of the ALB, which is providing LB services to the 2x Fargate container tasks.

Step-3: Review the Fargate Service

On the AWS Console, go to “Elastic Container Service (ECS) —> Cluster” and we can see an ECS cluster “default” has been created, with 1x Fargate service defined and 2x container tasks/pods running.

and here are the two running container tasks/pods:

Click any of the tasks to confirm its running our demo app image deployed from the ECR repository.

Next, search for AWS service “Developer Tools —> CodePipeline“, you’ll see our Pipeline has been deployed with a (1st) successful execution.

Now search for “EC2 —> Load Balancer”, confirm that an ALB has been created and it should be deployed on two different subsets across two AZs.

This is because we are spreading the 2x ECS container tasks onto two AZs for high availability

Go to the ALB public DNS/URL and you should see the default page of our demo app running on AWS Fargate, cool!

Step-4: Test the Pipeline Run

It’s testing time now! As discussed, the pipeline is synced to Github repository and will be triggered by a push to master event. The actual build task is defined within the buildspec.yaml which contains a simple 3-stage process as per below. Note the output of the build process includes a json artifact (imagedefinitions.json) which includes the ECR path for the latest build image.

version: 0.2
phases:
  pre_build:
    commands:
      - echo Logging in to Amazon ECR...
      - aws --version
      - eval $(aws ecr get-login --region $AWS_DEFAULT_REGION --no-include-email)
      - REPOSITORY_URI=$AWS_ACCOUNT_ID.dkr.ecr.$AWS_REGION.amazonaws.com/$IMAGE_REPO_NAME
      - IMAGE_TAG=$(echo $CODEBUILD_RESOLVED_SOURCE_VERSION | cut -c 1-7)
  build:
    commands:
      - echo Build started on `date`
      - echo Building the Docker image...
      - REPO_URI=$AWS_ACCOUNT_ID.dkr.ecr.$AWS_REGION.amazonaws.com/$IMAGE_REPO_NAME
      - docker pull $REPO_URI:latest || true
      - docker build --cache-from $REPO_URI:latest --tag $REPO_URI:latest --tag $REPO_URI:$IMAGE_TAG .
  post_build:
    commands:
      - echo Build completed on `date`
      - echo Pushing the Docker images...
      - REPO_URI=$AWS_ACCOUNT_ID.dkr.ecr.$AWS_REGION.amazonaws.com/$IMAGE_REPO_NAME
      - docker push $REPO_URI:latest
      - docker push $REPO_URI:$IMAGE_TAG
      - echo Writing image definitions file...
      - printf '[{"name":"demo-app","imageUri":"%s"}]' "$REPO_URI:$IMAGE_TAG" | tee imagedefinitions.json
artifacts:
  files: imagedefinitions.json

To test the pipeline run, we’ll make a “cosmetic change” to the app revision (v1.0 —> v1.1)

Commit and push to master.

As expected, this has triggered a new pipeline run

Soon you’ll see two additional pods are launching with a new revision number of “3” — this is because by default Fargate implements a rolling update deployment strategy with a default minimum healthy percent of 100%. So it will not remove the previous container pods (revision 2) until the new ones are running and ready.

Once the v3 Pods are running and we can see the v2 pods are being terminated and de-registered from the service.

Eventually the v2 pods are removed and the Fargate service is now updated with revision 3, which consists of the new pods running our demo app “v1.1”.

In the CodePipeline history, verify the new build & deployment process have been completed successfully.

Also, verify the new image (tag “99cc610”) of the demo app is pushed to ECR as expected.

Go to the Fargate tasks (revision 3) again and verify the container pods are indeed running on the new image “99cc610”.

Refresh the ALB address to see the v1.1 app page loading — Magic!

Provision an AWS EKS Cluster with Terraform

In this post we’ll provision an AWS Elastic Kubernetes Service (EKS) Cluster using Terraform. EKS is an upstream compliant Kubernetes solution that is fully managed by AWS.

I have provided a sample Terraform script at here. It will build a multi-AZ EKS cluster that looks like this:

Specifically, we’ll be launching the following AWS resources:

  • 1x new VPC for hosting the EKS cluster
  • 3x private subnets (across 3x different AZ) for the EKS worker nodes
  • 3x public subnets for hosting ELBs (mapped to EKS external Load Balancer services)
  • 1x NAT Gateway for Internet access and publishing external services
  • 2x Auto-Scaling Groups for 2x EKS worker groups, with different IAM instance sizes (each ASG is set to a desired capacity of 2x, so we’ll get a total of 4x worker nodes)
  • 2x Security Groups attached to the 2x ASGs for management access

PREREQUISITES

  • Access to an AWS testing environment
  • Install Git, Terraform & Kubectl on your client
  • Install AWS toolkits including AWS CLI, AWS-IAM-Authenticator
  • Check the NTP clock & sync status on your client —> important!
  • Clone the Terraform Repo
git clone https://github.com/sc13912/tf-aws-eks.git

Step-1: Set the AWS Environment Variables and run the Terraform script

[root@cloud-ops01 tf-aws-eks]# aws configure
AWS Access Key ID [*****]: 
AWS Secret Access Key [***]: 
Default region name [us-east-1]: 
Default output format [json]:
terraform init
terraform apply

The process will take about 10~15 mins and your Terraform output should look like this:

Register the cluster and update the kubeconfig file with the correct cluster name.

[root@cloud-ops01 tf-aws-eks]# aws eks --region us-east-1 update-kubeconfig --name demo-eks-zUqzVyxb
Added new context arn:aws:eks:us-east-1:979459205431:cluster/demo-eks-zUqzVyxb to /root/.kube/config

Step-2: Verify the EKS Cluster status

Verify we can access the EKS cluster and the 4x worker nodes that have just been created.

[root@cloud-ops01 tf-aws-eks]# kubectl get nodes
NAME                         STATUS   ROLES    AGE   VERSION
ip-10-0-1-113.ec2.internal   Ready    <none>   43m   v1.16.8-eks-e16311
ip-10-0-1-40.ec2.internal    Ready    <none>   43m   v1.16.8-eks-e16311
ip-10-0-2-26.ec2.internal    Ready    <none>   43m   v1.16.8-eks-e16311
ip-10-0-3-23.ec2.internal    Ready    <none>   43m   v1.16.8-eks-e16311

Run kubectl describe nodes and we can see each node has been tagged with a few customised labels based on its unique properties. These are important metadata which can be used for selective Pod/Node deployment and other use cases like affinity or anti-affinity rules.

Now log into the AWS console, navigate to EC2 —> Auto Scaling —> Auto Scaling Groups, you’ll find the two ASGs that have been provisioned by Terraform.

Now check the EC2 instances, we should have 2+2 work nodes with different ASG instance sizes, and they should be randomly distributed across all 3x AZs.

Step-3: Deploy Kubernetes Add-on Services

  • Install Metrics-Server to provide cluster-wide resource metrics collection and to support use cases such as Horizontal Pod Autoscaling (HPA)
[root@cloud-ops01 tf-aws-eks]# kubectl apply -f https://github.com/kubernetes-sigs/metrics-server/releases/download/v0.3.6/components.yaml 

wait a for a few seconds and verify we now have resource stats

[root@cloud-ops01 tf-aws-eks]# kubectl top nodes
NAME                         CPU(cores)   CPU%   MEMORY(bytes)   MEMORY%   
ip-10-0-1-113.ec2.internal   88m          9%     417Mi           27%       
ip-10-0-1-40.ec2.internal    126m         6%     600Mi           17%       
ip-10-0-2-26.ec2.internal    360m         18%    760Mi           22%       
ip-10-0-3-23.ec2.internal    84m          8%     454Mi           30%       
  • Next, deploy a NGINX Ingress Controller so we can use L7 URL load balancing.
[root@cloud-ops01 tf-aws-eks]# kubectl apply -f https://raw.githubusercontent.com/kubernetes/ingress-nginx/controller-0.32.0/deploy/static/provider/aws/deploy.yaml

verify the Ingress pods and services are running

[root@cloud-ops01 tf-aws-eks]# kubectl get pods -n ingress-nginx 
NAME                                        READY   STATUS      RESTARTS   AGE
ingress-nginx-admission-create-2fvlb        0/1     Completed   0          103s
ingress-nginx-admission-patch-4tvnk         0/1     Completed   0          102s
ingress-nginx-controller-5cc4589cc8-7fr64   1/1     Running     0          117s
[root@cloud-ops01 tf-aws-eks]# 
[root@cloud-ops01 tf-aws-eks]# kubectl get svc -n ingress-nginx  
NAME                                 TYPE           CLUSTER-IP       EXTERNAL-IP                                                                     PORT(S)                      AGE
ingress-nginx-controller             LoadBalancer   172.20.114.166   aaa1d4619924247688fc4eeb4f85cd48-76f9a6f87fe42022.elb.us-east-1.amazonaws.com   80:31060/TCP,443:31431/TCP   2m2s
ingress-nginx-controller-admission   ClusterIP      172.20.3.211     <none>  
  • In addition, we’ll deploy some storage classes (with different I/O specification) to provide dynamic persistent storage required for stateful pods and services.
[root@cloud-ops01 tf-aws-eks]# kubectl apply -f ./storage/storageclass/  
storageclass.storage.k8s.io/fast-50 created
storageclass.storage.k8s.io/standard created
  • Optionally, we can deploy the Kubernetes dashboard for some basic UI visibility.
[root@cloud-ops01 tf-aws-eks]# kubectl apply -f https://raw.githubusercontent.com/kubernetes/dashboard/master/aio/deploy/recommended.yaml  
[root@cloud-ops01 tf-aws-eks]# kubectl apply -f ./kube-dashboard/  

Retrieve the dashboard token.

[root@cloud-ops01 tf-aws-eks]# SA_NAME=admin-user  
[root@cloud-ops01 tf-aws-eks]# kubectl -n kube-system describe secret $(kubectl -n kube-system get secret | grep ${SA_NAME} | awk '{print $1}')  
... 
token:      eyJhbGciOiJSUzI1NiIsImtpZCI6IlFsUzNqaW9iNFVsXy1BNlppdk9YZVVDZkFxMTJqeGMtSlA0LXN5QjZDdkkifQ.eyJpc3MiOiJrdWJlcm5ldGVzL3NlcnZpY2VhY2NvdW50Iiwia3ViZXJuZXRlcy5pby9zZXJ2aWNlYWNjb3VudC9uYW1lc3BhY2UiOiJrdWJlLXN5c3RlbSIsImt1YmVybmV0ZXMuaW8vc2VydmljZWFjY291bnQvc2VjcmV0Lm5hbWUiOiJhZG1pbi11c2VyLXRva2VuLTliODdiIiwia3ViZXJuZXRlcy5pby9zZXJ2aWNlYWNjb3VudC9zZXJ2aWNlLWFjY291bnQubmFtZSI6ImFkbWluLXVzZXIiLCJrdWJlcm5ldGVzLmlvL3NlcnZpY2VhY2NvdW50L3NlcnZpY2UtYWNjb3VudC51aWQiOiJjNjkwZTk5Zi0zM2ViLTRlZjctYTA2Ny03MDVjMTE3ODI1NjUiLCJzdWIiOiJzeXN0ZW06c2VydmljZWFjY291bnQ6a3ViZS1zeXN0ZW06YWRtaW4tdXNlciJ9.h1a_8pySJ7hebSci-mP8tPXmCY0vCQOCKzeDKICDMEE4Qlt-FGSwoBMEzTLLcA2-MUtDjkzbjJlFPZMl2EsiaxPbP63_yn_0l4hZqMdM4nKjvrtVCXUvY9fJOREj3lNvG4Uy1QiyU3pgKbUKdFpvSYPVPGmqq_hFTc5U9KXwk_bBgIIJr9S2a8_yIvchMtTrsxdh3O1P-AeP5Bd5FZJSG9QeI2z1guD8ewWOa2W4Z5E4wKZ10yVVslhh_OcQgQ2eBvtDD6_mrDwSs1tQUbY83jbHR7yYOTYmz-v2EnLWb3cUbO8u3EHL_qWjRTPcMTuH9RLZwTf7CLH6RYoEVlUvLw

Get the dashboard LB service address.

[root@cloud-ops01 tf-aws-eks]# kubectl get svc kubernetes-dashboard  -n kubernetes-dashboard  
NAME                   TYPE           CLUSTER-IP      EXTERNAL-IP                                                              PORT(S)         AGE
kubernetes-dashboard   LoadBalancer   172.20.62.179   aa2e50aa1703d4163a87c1dbe5bab77a-723142651.us-east-1.elb.amazonaws.com   443:30822/TCP   6m46s

Point to the URL in the browser, copy & paste the token for authentication and you should land on a dashboard page like this:

Step-4: Deploy sample apps on the EKS cluster for testing

  • Firstly, deploy the provided sample Guestbook app to verify the persistent storage setup.
[root@cloud-ops01 tf-aws-eks]# kubectl create ns guestbook-app  
[root@cloud-ops01 tf-aws-eks]# kubectl apply -f ./demo-apps/guestbook/    

The application requests 2x persistent volumes (PV) for the redis-master and redis-slave pods. Both PVs should be automatically provisioned by the persistent volume claims (PVC) with the 2x different storage classes as we deployed earlier. You should see the STATUS reported as “Bound” between each PV and PVC mapping.

[root@cloud-ops01 tf-aws-eks]# kubectl get pvc -n guestbook-app 
NAME                 STATUS   VOLUME                                     CAPACITY   ACCESS MODES   STORAGECLASS   AGE
redis-master-claim   Bound    pvc-ad5310a6-249f-4526-9ed6-0596b70fa171   2Gi        RWO            standard       38m
redis-slave-claim    Bound    pvc-a3e97098-600a-4ede-bc4a-e9235602d42c   4Gi        RWO            fast-50        38m

Again, retrieve the external IP/DNS for the frontend service for the Guestbook app.

[root@cloud-ops01 storageclass]# kubectl get svc -n guestbook-app 
NAME           TYPE           CLUSTER-IP       EXTERNAL-IP                                                               PORT(S)        AGE
frontend       LoadBalancer   172.20.19.131    a9e282a1efb6b4f97a288e183c68ac82-2013066277.us-east-1.elb.amazonaws.com   80:32578/TCP   45m

You should be able to access the Guestbook now. Enter and submit some messages, and try to destroy and re-redeploy the app, your data will be kept by the redis PVs.

  • Next, we’ll deploy a modified version of the yelb app to test the NGINX ingress controller
[root@cloud-ops01 tf-aws-eks]# kubectl create ns yelb  
[root@cloud-ops01 tf-aws-eks]# kubectl apply -f ./demo-apps/yelb/  

Retrieve the external DNS address for the ingress service within the yelb namespace. Notice the ingress URL path is defined as “yelb.local”. Next we’ll need to get the public IP of the ingress service and then update the local host file for a quick testing.

[root@cloud-ops01 tf-aws-eks]# kubectl get ingresses -n yelb
NAME           HOSTS        ADDRESS                                                                         PORTS   AGE
yelb-ingress   yelb.local   a8821ed5391434981a35cd6599ed7671-a0d9702f226e21d8.elb.us-east-1.amazonaws.com   80      63m

Run nslookup to get the public IP of the ingress service, then update the local host file.

Non-authoritative answer:
Name:   a8821ed5391434981a35cd6599ed7671-a0d9702f226e21d8.elb.us-east-1.amazonaws.com
Address: 54.175.25.189

[root@cloud-ops01 tf-aws-eks]# echo "54.175.25.189  yelb.local" >> /etc/hosts      

We should have access to the app now.